Friday, 10 February 2017

Arithmetic and Geometric Progression

Arithmetic Progression (AP):

Arithmetic progression is a sequence of numbers in which the difference of any two adjacent terms is constant. The constant difference is commonly known as common difference and is denoted by d. Examples of arithmetic progression are as follows:    


Example1: 

3, 8, 13, 18, 23, 28 33, 38, 43, 48
The above sequence of numbers is composed of n = 10 terms (or elements). The first term a1 = 3, and the last term an = a10 = 48. The common difference of the above AP is d = 8 - 3 = 13 - 8 = ... = 5.


  • Example 2:

    5, 2, -1, ...
    This AP has a common difference of -3 and is composed of infinite number of terms as indicated by the three ellipses at the end.


    Formula for Arithmetic Progression (AP):

    Common difference, d
    The common difference can be found by subtracting any two adjacent terms.


    Value of each term
    Each term after the first can be found by adding recursively the common difference d to the preceding term
    .


     nth term of AP
    The nth term of arithmetic progression is given by:


    or in more general term, it can be written as:


    Sum of n terms of AP
    The sum of the first n terms of arithmetic progression is n times the average of the first term and the last term.


    If the last term an is not given, the following may be useful


    If required for the partial sum from mth to nth terms, the following formula can be used


    Geometric Progression (GP):

    Geometric progression is a sequence of numbers in which any two adjacent terms has a common ratio denoted by r. Example of geometric progression is:

    1, 3, 9, 27, ...

    which is composed of infinite number of terms and with common ratio equal to 3.


    Formula for Geometric Progression (GP):

    Common ratio
    The common ratio can be found by taking the quotient of any two adjacent terms.


     nth term of GP
    The nth term of the geometric progression is given by


    Sum of n terms of GP
    The sum of the first n terms of geometric progression is


    Sum of Infinite Geometric Progression
    A finite sum can be obtained from GP with infinite terms if and only if -1.0 ≤ r ≤ 1.0 and r ≠ 0.


    Example 1: 
  •  
  • Find the terms a2, a3, a4 and a5 of a geometric sequence if a1 = 10 and the common ratio r = - 1.

    Solution to Example 1:

    Use the definition of a geometric sequence
    a2 = a1 * r = 10 * (-1) = - 10

    a3 = a2 * r = - 10 * (-1) = 10

    a4 = a3 * r = 10 * (-1) = - 10

    a5 = a4 * r = - 10 * (-1) = 10


    Example 2: 

    Find the 10 th term of a geometric sequence if a1 = 45 and the common ration r = 0.2.

    Solution to Example 2:

    Use the formula an = a1 * rn-1 that gives the n th term to find a10 as follows :
    a10 = a1 * rn-1 
    = 45 * 0.29 = 2.304 * 10-5


    Example 3:

    Find a20 of a geometric sequence if the first few terms of the sequence are given by


    -1/2 , 1/4 , -1/8 , 1 / 16 , ...
     
    Solution to Example 3: 

    We first use the first few terms to find the common ratio
    r = a2 / a1 = (1/4) / (-1/2) = -1/2

    r = a3 / a2 = (-1/8) / (1/4) = -1/2

    r = a4 / a3 = (1/16) / (-1/8) = -1/2
    The common ration r = -1/2. We now use the formula an = a1 * rn-1 for the n th term to find a20 as follows.
     a20 = a1 * r20-1
    = (-1/2) * (-1/2)20-1 = 1 / (2020)


    Video:


    Sequence and Number Pattern

    Number Sequence:

    In teaching number sequences, it is important to start with concrete examples using blocks or other manipulatives.
    It is easiest to start by showing the growth of a simple repeating pattern.

    Six cubes, alternating in colour between red and yellow.
    Simple repeating pattern.

    Show how it grows by adding successive identical units of repeat.

    Three groups of cubes alternating in colour between red and yellow. The groups grow by two each time, starting with two cubes.
    Growing pattern.

    Counting the number of blocks gives the sequence 2, 4, 6… Students can see that each time a unit of repeat is added, the total number of blocks increases by 2. Also, the total number of blocks is twice the number of units of repeat.


    Identical units of repeat:

    Repeating patterns can be used to introduce students to many concepts in the early mathematics curriculum, especially multiplication. However, students need to be able to find the unit of repeat in each pattern.
    The idea can be introduced using 'trains' of interlocking cubes arranged in a row.

    A line of six cubes made of three white-green pairs.
                   A train of six cubes.
    A line of twelve cubes made of four white-white-red groups.
               A train of twelve cubes.


    These trains can be made using the following units of repeat.

    Two adjoining cubes: one white, one green.
           A unit of repeat for the first train.
    Three adjoining cubes: two white followed by one red.
      A unit of repeat for the second train.


    The first unit is repeated three times, and the second one is repeated four times.
    Students can often copy or extend such patterns without being able to find a unit of repeat. For example, students often see the first pattern as 'alternating white and green' rather than 'white-green repeated'.
    If students cannot readily identify units of repeat in one-dimensional patterns, then they may not be able to grasp the multiplication that is implicit in such patterns.


    Number Patterns:


    Using Patterns to Solve Problems

    When solving problems that involve greatest common factors, you can use patterns to help. 

    Let's look at an example:

    Name the next value in the series. 4, 7, 10, 13, ______
    First, you need to identify the pattern by looking at the numbers.
    4 + 3 = 7; 7 + 3 =10, 10 + 3 = 13

    The pattern consists of adding 3 to the previous number, so the next number will be the sum of 13 and 3.
    13 + 3 = 16
    The answer is 16.

    Although the first example involved addition, any of the four operations can be used when trying to identify the pattern. 

    Let's look at an example of a pattern that uses multiplication.
    Name the next value in the series. 2, 6, 18, 54, _____

    Notice that the next number is found by multiplying the current number by 3. Based on that pattern, the next number will be the product of 54 and 3.
     54×3=162
    The next number in the series is 162.

    Example 1: 

    Earlier, you were given a problem about Coach Gerald.
    His team is in a tournament in which teams are knocked out in each round. He wants his team to understand the number of games that they will have to win in order to win the tournament, so he provides his team with part of the pattern that the winners of each round experience.

    32, 16, 8, 4, ______
    What is the next number in the pattern that Coach Gerald wrote for his players?

    First, figure out what changes between the given values.
    32 - 16 = 16; 16 - 8 = 8; 8 - 4 = 4

    Next, look at the changes and determine the pattern. 
    Subtract half of the previous number from the current number to calculate the next number.

    Then, find the next number.
    4 - 2 = 2
    The answer is 2.


    Example 2:

    What is the next number in this sequence?
    1, 1, 2, 3, 5, 8, 13, 21, _____

    First, figure out what changes between the given values.
    1 + 0 = 1; 1 + 1 = 2; 2 + 1 = 3; 3 + 2 = 5; 5 + 3 = 8; 8 + 5 = 13; 13 + 8 = 21

    Next, look at the changes and determine the pattern.
    The next number is found by finding the sum of the current number and the number before it.

    Then, determine the next number.
    21 + 13 = 34
    The next number is 34.

    Example 3:

    Name the next value in the series.
    3, 7, 15, 31, _____

    First, figure out what changes between the given values.
    3 + 4 = 7; 7 + 8 = 15; 15 + 16 = 31

    Next, look at the changes and determine the pattern.
    Add 2 times the previous number that was added

    Then, determine the next number.
    31 + 2(16) = 31 + 32 = 63
    The answer is 63.


    Video:


    Introduction of Statistical Data

    In statistical data we need to Collect, organize and presenting a large amount of data by using bar charts, pictograph, line graph and dot plot.

    Bar chart :

    Bar charts are a type of graph that are used to display and compare the number, frequency or other measure (e.g. mean) for different discrete categories of data


    This is the example of bar chart:
                                                                                     
    Bar graph:


    Questions:                     
    1. What is the title of this bar graph?                           
    2. What is the range of values on the (vertical) scale?                         
    3. How many categories are in the graph?                
    4. Which food had the highest percentage of sugar?
    5. Which food had the lowest percentage of sugar?            
    6. What percentage of sugar is in soda?     
    7. What is the difference in percentage of sugar between ice cream and crackers?                               
    Answers:

    1. 1   Amount of sugar of certain food.
    2. 20 – 35
    3. 37
    4. Chocolate bar
    5. Ketchup
    6. 28.9 %
    7. 21.4 – 11.8 = 9.6 


    Dot Plot:

    The student one social studies class were asked how many brothers and sister they have. The plot here shows the result.


    Questions:

    1. How many of the students have six siblings?
    2. How many of student don’t have siblings?
    3. How many of student have three or more siblings?


    Answers:

    1. How many of the students have six siblings?                   =    1
    2. How many of student don’t have siblings?                         =    3
    3. How many of student have three or more siblings?          =   11

    Thursday, 9 February 2017

    Linear Programming

    Linear Programming sounds really difficult, but it’s just a neat way to use math to find out the best way to do things – for example, how many things to make or buy.  It usually involves a system of linear inequalities, called constraints, but in the end, we want to either maximize something (like profit) or minimize something (like cost).   Whatever we’re maximizing or minimizing is called the objective function.


    Bounded and Unbounded Regions:

    With our Linear Programming examples, we’ll have a set of compound inequalities, and they will be bounded inequalities, meaning the inequalities will have both maximum and minimum values.  (We’ll show examples below, but think of bounded meaning that you could draw a “circle” around the feasible region, which is the solution set to the inequalities).

    Here are what some typical Systems of Linear Inequalities might look like in Linear Programming: 


    Bounded and Unbounded Inequalities


    Video:


    Sunday, 5 February 2017

    Permutation and Combination

    Permutations and Combinations are the next step in the learning of probability. It is by using permutation and combinations that we can find the probabilities of various events occurring at the same time, such as choosing 3 boys and 3 girls from a class of grade 12 math students.

    In mathematics, we use more precise language:

    If the order doesn't matter, it is a combination.
    If the order does matter, it is a permutation.


    Example 1:

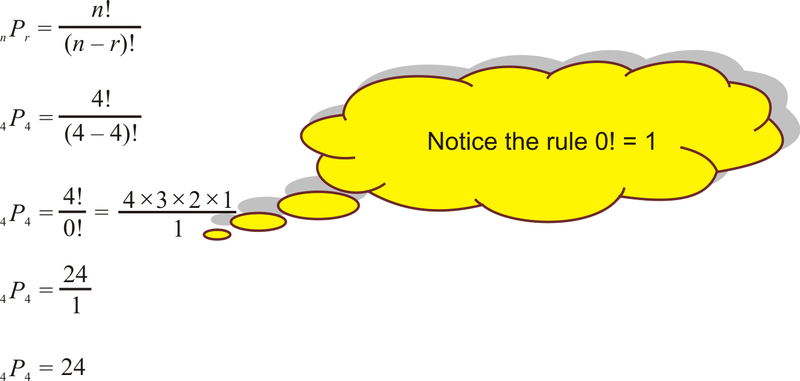
    What is the total number of possible 4-letter arrangements of the letters 's', 'n', 'o', and 'w' if each letter is used only once in each arrangement?

    In this problem, there are 4 letters to choose from, so n=4. We want 4-letter arrangements; therefore, we are choosing 4 objects at a time. In this example, r=4.


     Example 2:

    A committee is to be formed with a president, a vice president, and a treasurer. If there are 10 people to select from, how many committees are possible?

    In this problem, there are 10 committee members to choose from, so n=10. We want to choose 3 members to be president, vice-president, and treasurer; therefore, we are choosing 3 objects at a time. In this example, r=3.
     

    Example 3:

    Here’s a few examples of combinations (order doesn’t matter) from permutations (order matters). 


    • Combination: Picking a team of 3 people from a group of 10. C(10,3) = 10!/(7! · 3!) = 10 · 9 · 8 / (3 · 2 · 1) = 120.

      Permutation: Picking a President, VP and Waterboy from a group of 10. P(10,3) = 10!/7! = 10 · 9 · 8 = 720.
    • Combination: Choosing 3 desserts from a menu of 10. C(10,3) = 120.

      Permutation: Listing your 3 favorite desserts, in order, from a menu of 10. P(10,3) = 720.    


     Video:


    Saturday, 4 February 2017

    Probability

    Definition:

    Probability is the likelihood of something happening. When someone tells you the probability of something happening, they are telling you how likely that something is. When people buy lottery tickets, the probability of winning is usually stated, and sometimes, it can be something like 1/10,000,000 (or even worse). This tells you that it is not very likely that you will win.

    Formula:

    The formula for probability tells you how many choices you have over the number of possible combinations.


    Example 1:

    Suppose a coin is flipped 3 times. What is the probability of getting two tails and one head?

    Solution: For this experiment, the sample space consists of 8 sample points.


    S = {TTT, TTH, THT, THH, HTT, HTH, HHT, HHH}

    Each sample point is equally likely to occur, so the probability of getting any particular sample point is 1/8. The event "getting two tails and one head" consists of the following subset of the sample space.

    A = {TTH, THT, HTT}

    The probability of Event A is the sum of the probabilities of the sample points in A. Therefore,

    P(A) = 1/8 + 1/8 + 1/8 = 3/8
    **In this case,you can use a tree diagram to look at which is getting two tails and one head faced coin.

    Example 2:

    Two dice are thrown together.
    Use a tree diagram to find the probability that one number is even and the other is odd.


    There are six possible scores on one die: {1, 2, 3, 4, 5, 6}
    Of these, three are even: {2, 4, 6} and three are odd: {1, 3, 5}


    So, the tree diagram looks like this:


     So the probability that one number is even and the other is odd


    Example 3:

    Two dice are rolled, find the probability that the sum is
    a) equal to 1

    b) equal to 4

    c) less than 13


    Solution to Example 3:

    The sample space S of two dice is shown below.

    S = { (1,1),(1,2),(1,3),(1,4),(1,5),(1,6)
             (2,1),(2,2),(2,3),(2,4),(2,5),(2,6)
             (3,1),(3,2),(3,3),(3,4),(3,5),(3,6)
             (4,1),(4,2),(4,3),(4,4),(4,5),(4,6)
             (5,1),(5,2),(5,3),(5,4),(5,5),(5,6)
             (6,1),(6,2),(6,3),(6,4),(6,5),(6,6) }  


    a) Let E be the event "sum equal to 1". There are no outcomes which correspond to a sum equal to 1, hence

    P(E) = n(E) / n(S) = 0 / 36 = 0 

    b) Three possible outcomes give a sum equal to 4: E = {(1,3),(2,2),(3,1)}, hence

     P(E) = n(E) / n(S) = 3 / 36 = 1 / 12

    c) All possible outcomes, E = S, give a sum less than 13, hence.

     P(E) = n(E) / n(S) = 36 / 36 = 1 


    Video: